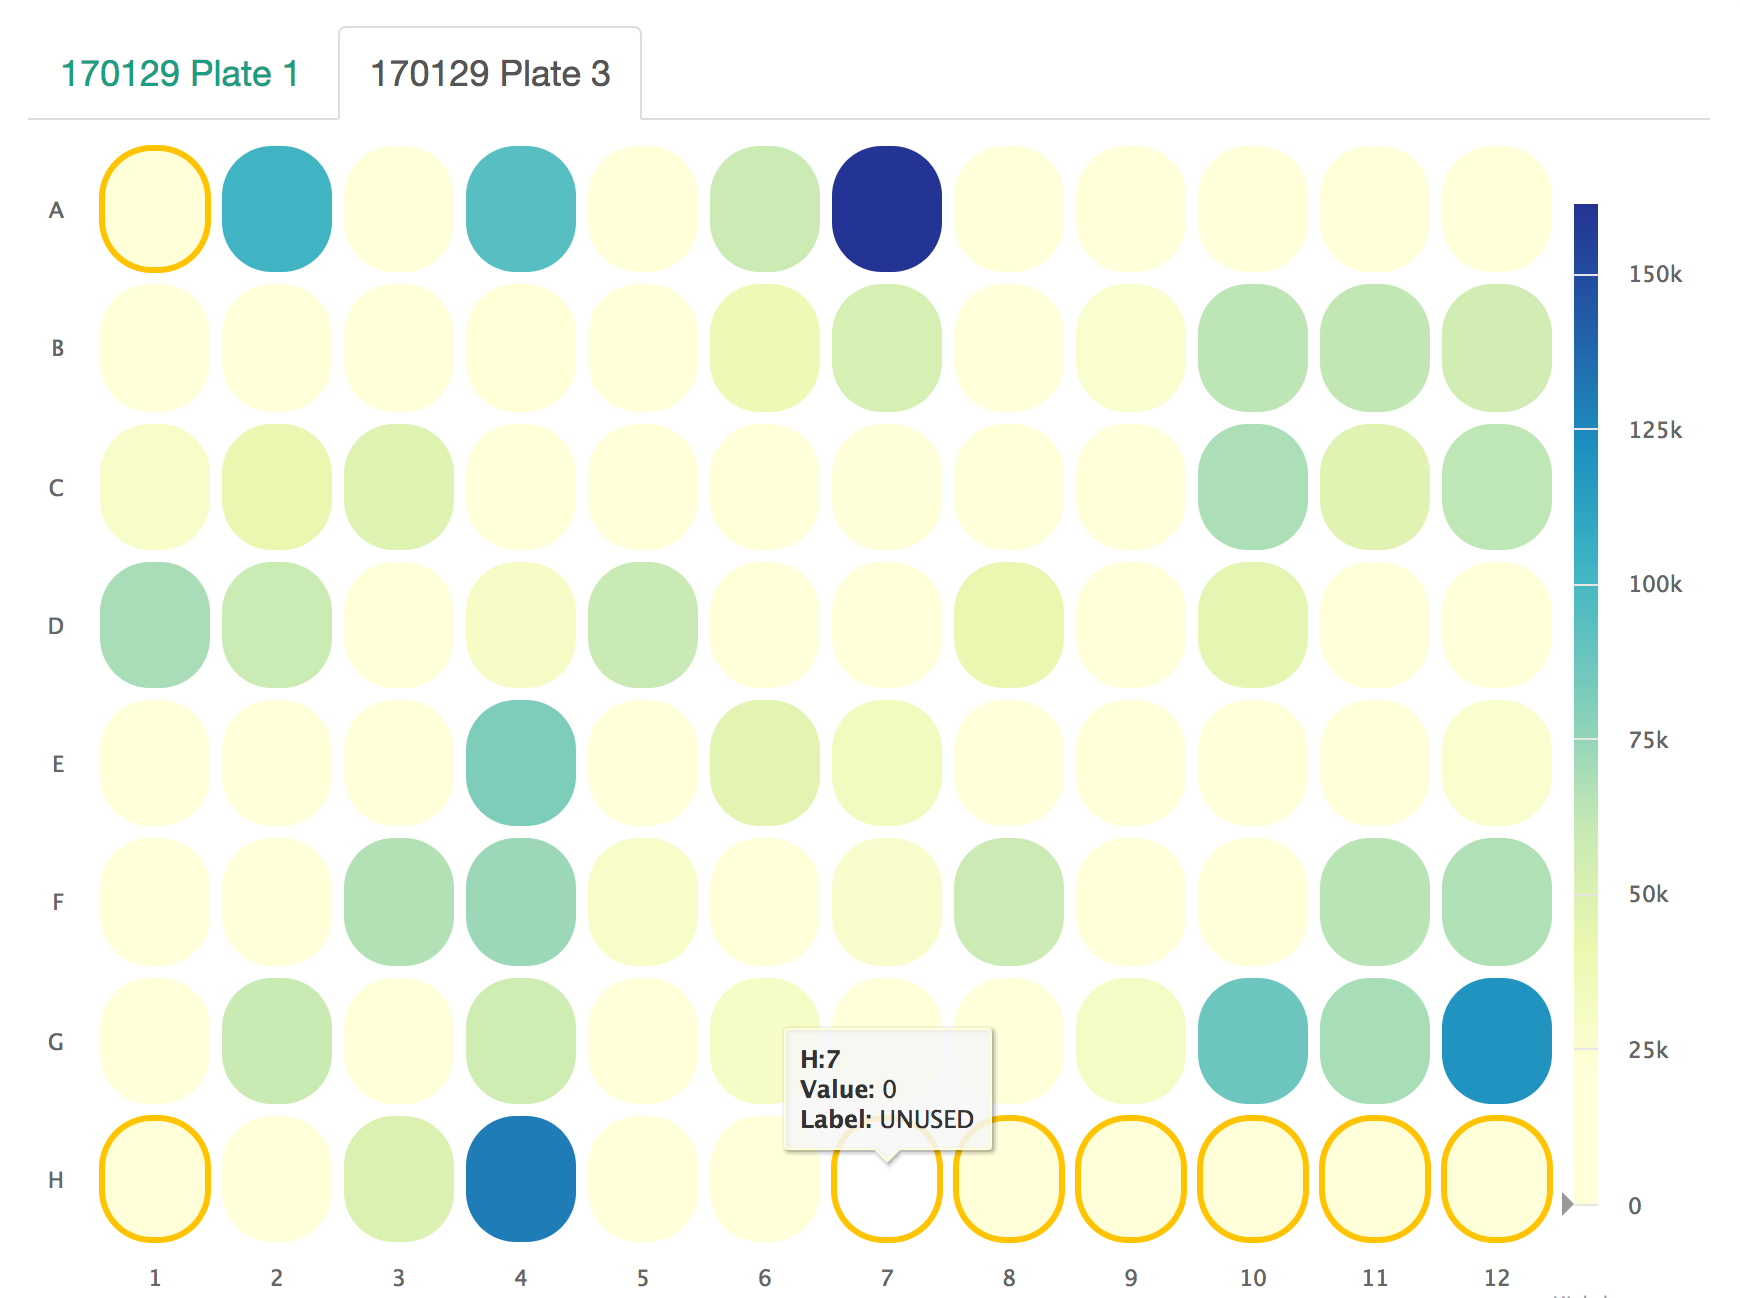
Plate Heatmap
This plot is intended to be a nicely spaced heatmap specifically for showing trends over sample plates. Definitions for colors are optional and will be used to outline their respective coordinates.
An example for this plot type is executed in the workflow at plate-heatmap-example.
Example Data
This is an alternate example from the workflow to show how to deal with multiple label colors.
| WELL_COL | WELL_ROW | TOTAL_PAIRED_READS | LABEL | LABEL_COLOR |
|---|---|---|---|---|
| 1 | A | 205 | sample1 | |
| 2 | A | 103 | POS CTRL | #d62728 |
| 3 | A | 125 | NEG CTRL | #1f77b4 |
Usage to Add
$ fqc add --x-value WELL_COL --y-value WELL_ROW \
      --value TOTAL_PAIRED_READS --label LABEL \
      --label-color LABEL_COLOR \
      plot_data/2016/160912_M03018/config.json \
      'Abundance by Plate' \
      plateheatmap \
      data/tables/160912_plate_1.csv
Plot Options
| Option | Value |
|---|---|
| filename | supports either a single file path or list of lists with [plot tab name, file path] pairs (see Plot Tabs) |
| tab_name | left main menu entry |
| status | left main menu icon – supports ‘pass’, ‘fail’, ‘warn’, or alternatively, omitted (see Tab Status) |
| chart_properties | See table below |
Chart Properties
| Option | Value |
|---|---|
| type | the required entry is ‘plateheatmap’ |
| subtitle | an optional subtitle for the plot |
| x_label | x-axis label |
| x_value | the header label defined in filename corresponding to x-values |
| y_label | y-axis label |
| y_value | the header label defined in filename corresponding to y-values |
| label | the header label defined in filename corresponding to point labels; displayed on hover when specified |
| label_color | header of column containing colors; acts to color surrounding point to highlight |
Example JSON entry:
{
    "filename": "160912_plate_1.csv",
    "tab_name": "Abundance by Plate",
    "chart_properties": {
        "type": "plateheatmap",
        "x_value": "WELL_COL",
        "x_label": "WELL_COL",
        "y_value": ["WELL_ROW"],
        "y_label": "WELL_ROW",
        "value": "TOTAL_PAIRED_READS",
        "label": "LABEL",
        "label_color": "LABEL_COLOR"
    }
}