Plot Tabs
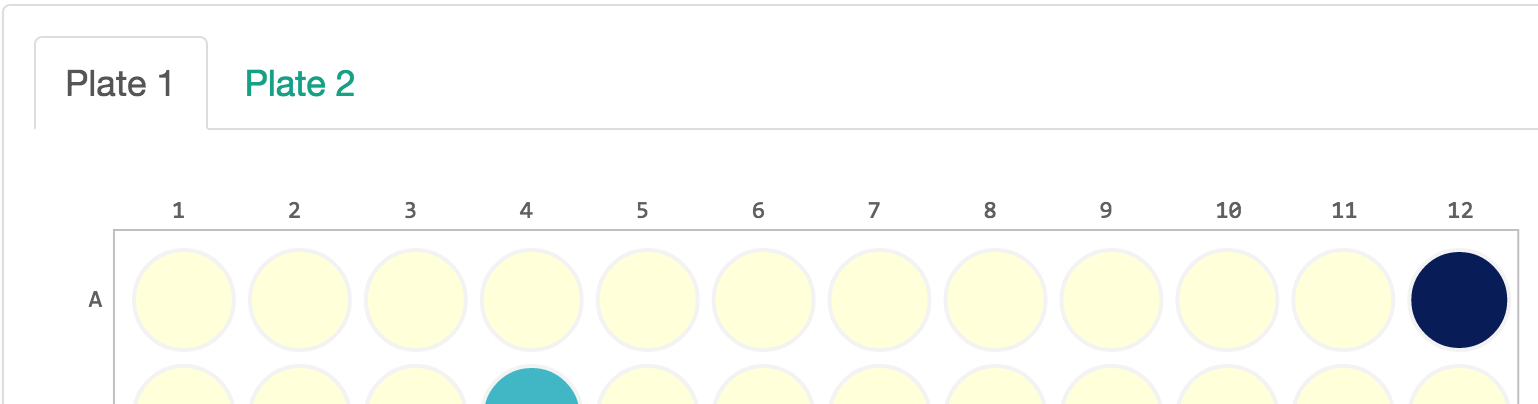
Tabs can be added to the plot area using a list of lists for the filename
attribute. The first position is the name of the tab while the second is the
file path. An example JSON entry for this in a sample’s config.json looks
like:
"filename": [
        [
            "Plate 1",
            "plt1_counts.csv"
        ],
        [
            "Plate 2",
            "plt2_counts.csv"
        ]
]
Which will render as: