Bar
No bar plots are automatically generated from FastQC output, but can optionally be added for custom data tables.
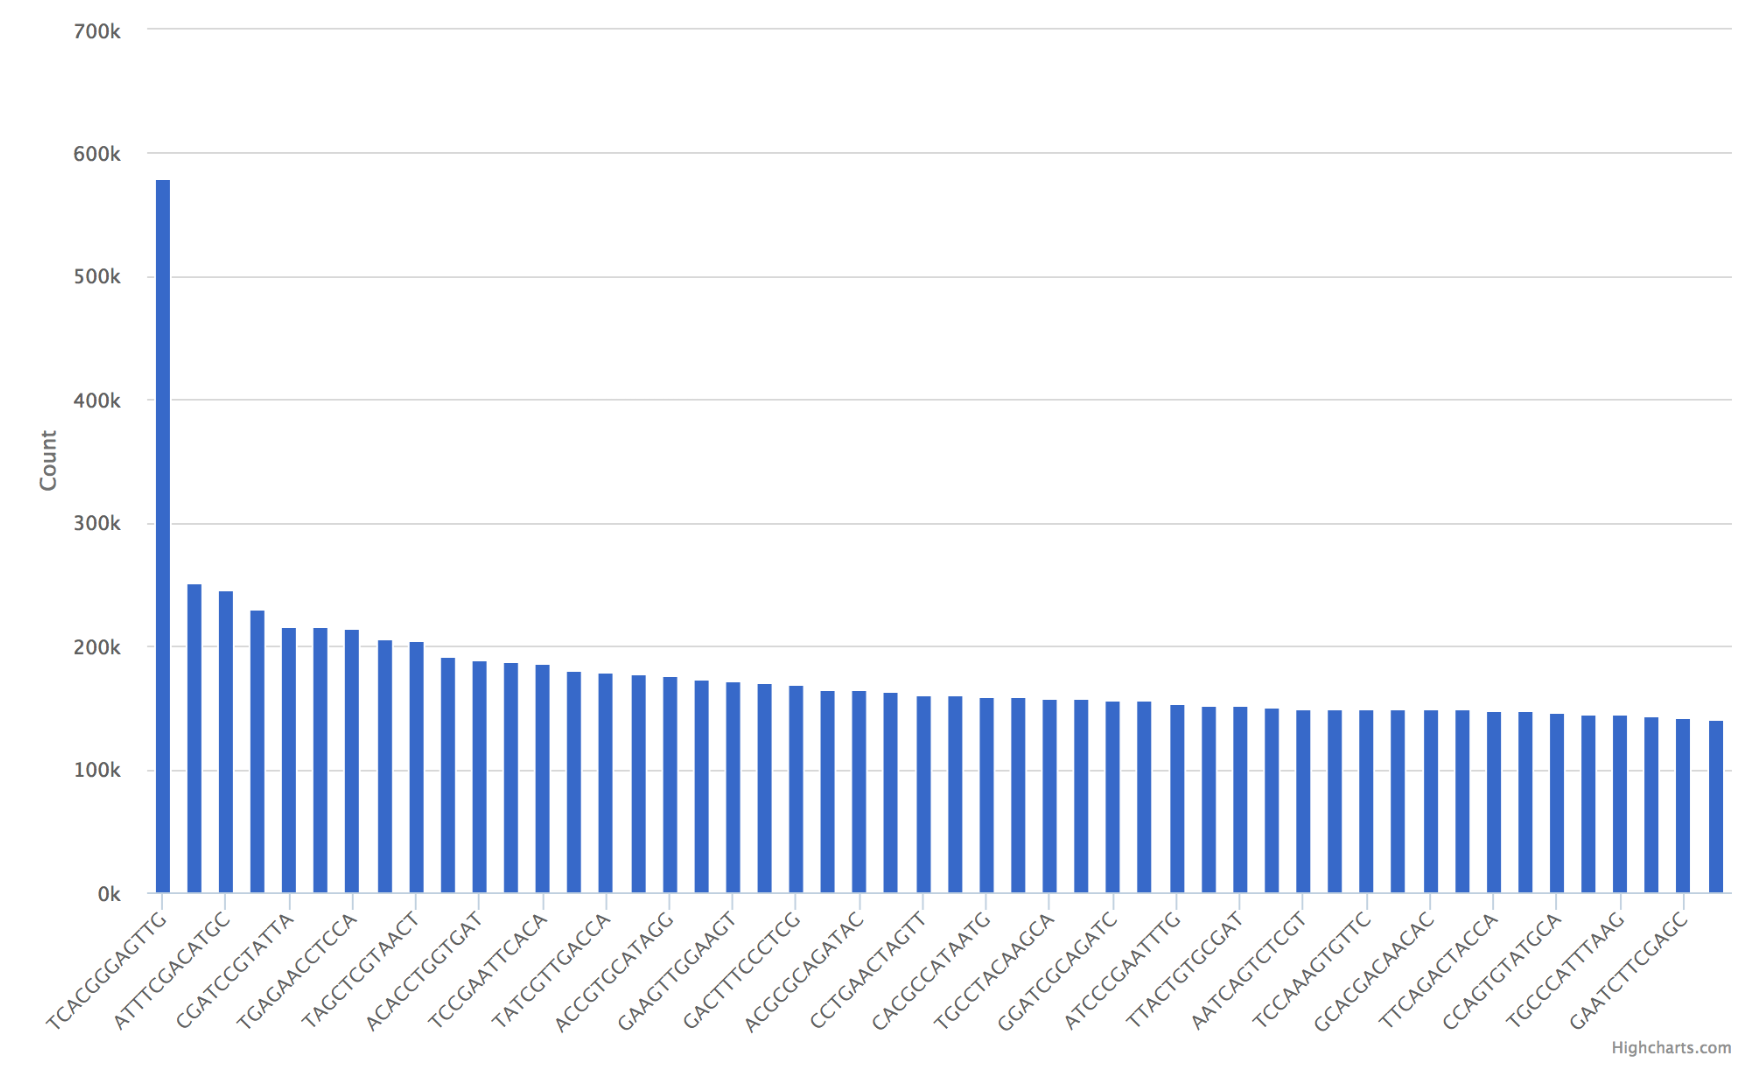
Example Data
| Barcode | Count |
|---|---|
| TCACGGGAGTTG | 579558 |
| AGTTCAGACGCT | 250808 |
| ATTTCGACATGC | 245063 |
| TAATGACCACGC | 230339 |
| CGATCCGTATTA | 215466 |
Usage to Add
Given the example data for barcode counts:
$ fqc add --x-value Barcode --y-value Count \
      plot_data/2016/160912_M03018/config.json \
      "Barcode Counts" \
      bar \
      example/data/tables/160912_top50barcodes.csv
Plot Options
| Option | Value |
|---|---|
| filename | supports either a single file path or list of lists with [plot tab name, file path] pairs (see Plot Tabs) |
| tab_name | left main menu entry |
| status | left main menu icon – supports ‘pass’, ‘fail’, ‘warn’, or alternatively, omitted (see Tab Status) |
| chart_properties | See table below |
Chart Properties
| Option | Value |
|---|---|
| type | the required entry is ‘bar’ |
| subtitle | an optional subtitle for the plot |
| x_label | x-axis label |
| x_value | the header label defined in filename corresponding to x-values |
| y_label | y-axis label |
| y_value | the header label defined in filename corresponding to y-values |
Example JSON entry:
{
    "filename": "bar_plot_example.csv",
    "tab_name": "Barcode Counts",
    "chart_properties": {
        "type": "bar",
        "x_value": "Barcode",
        "x_label": "Barcode",
        "y_value": [ "Count" ],
        "y_label": "Count"
}