Histogram
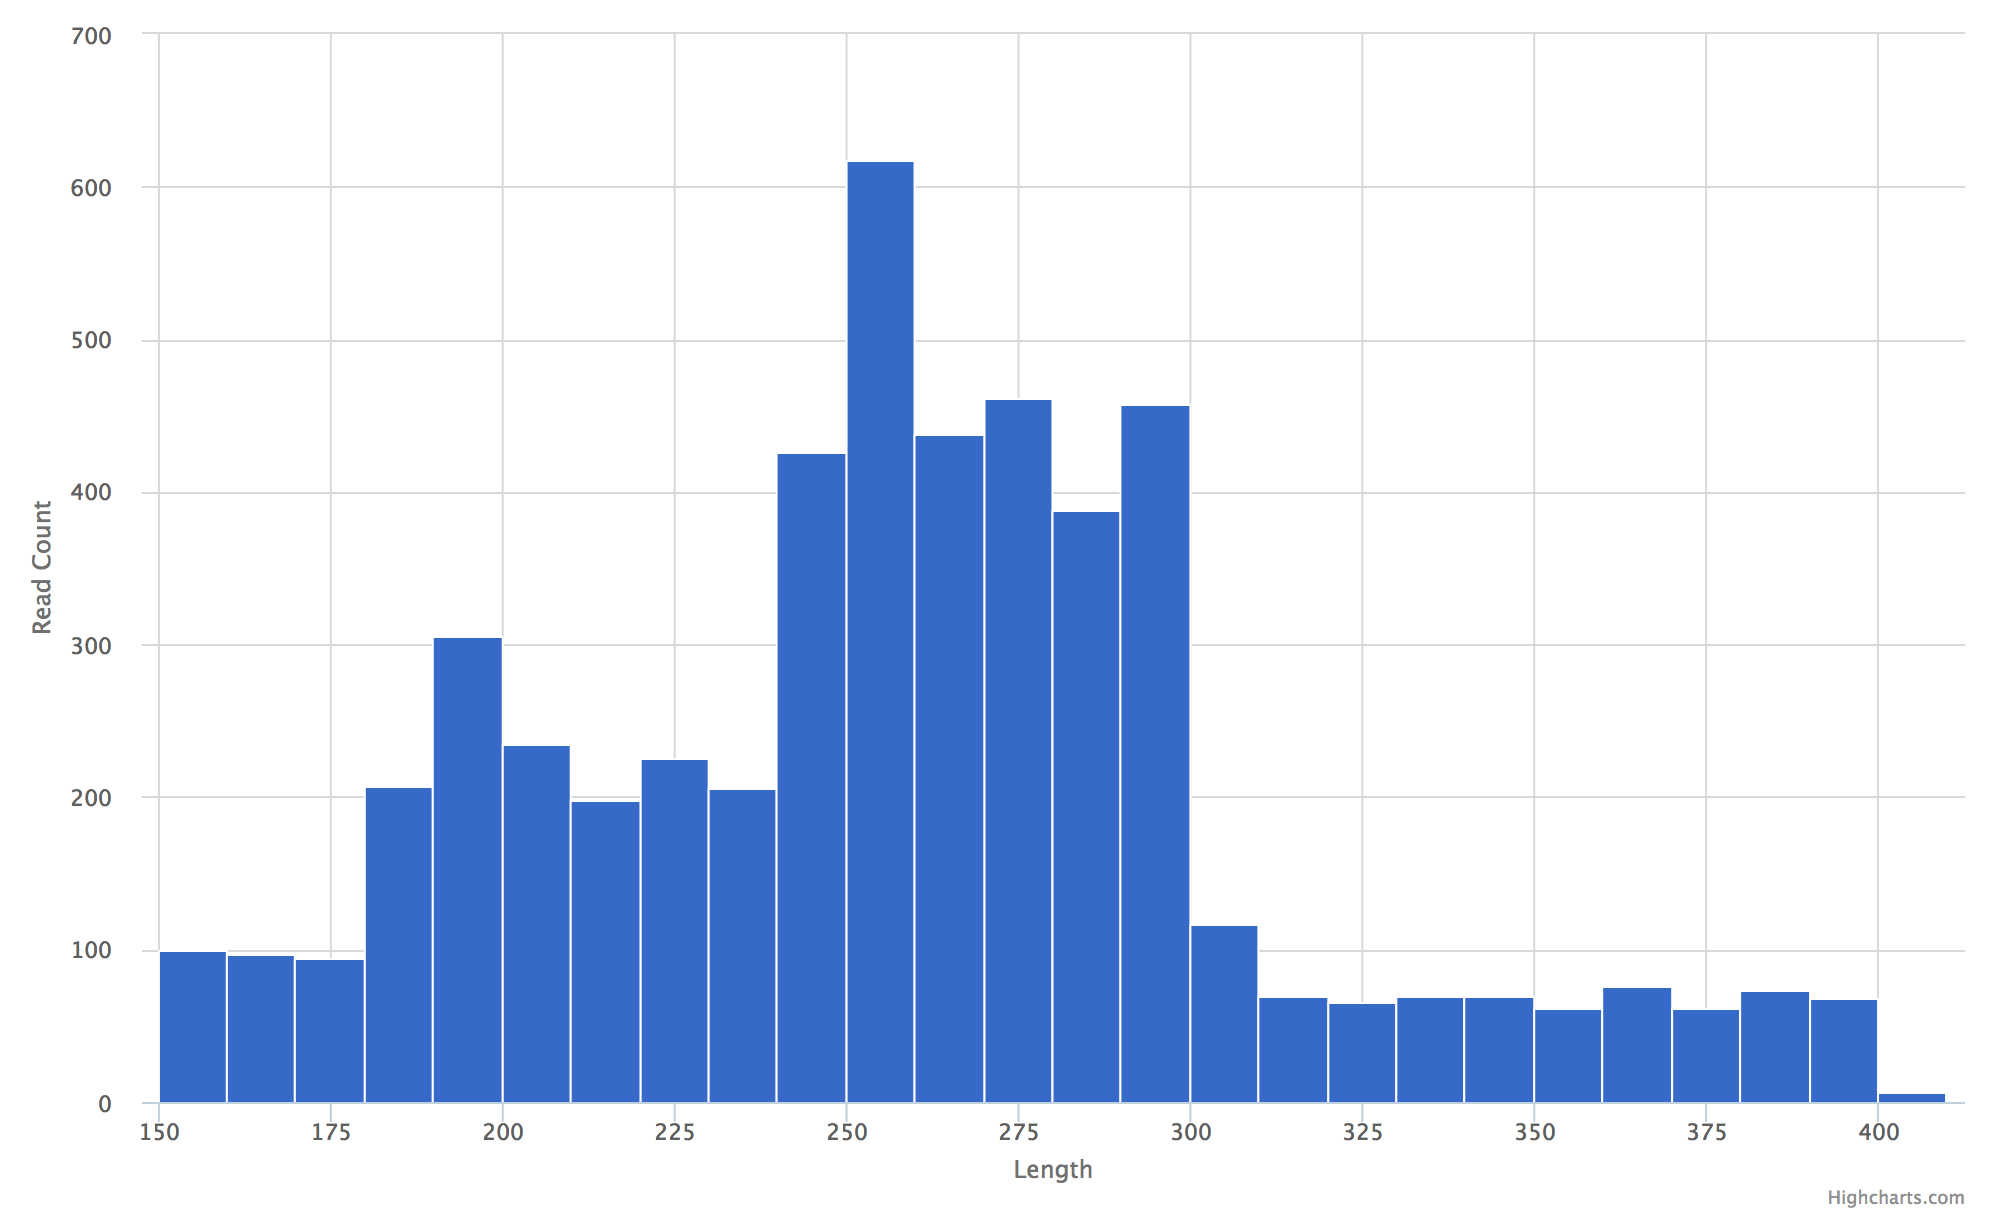
This plot is useful in the context of 16S amplicon sequencing after we’ve quality trimmed reads then joined paired-end reads. Tabulating observed read lengths and their respective counts can give insights into the quality of the sequence ends.
Example Data
| Length |
|---|
| 153 |
| 179 |
| 177 |
| 191 |
| 198 |
Usage to Add
Given the example data for read length counts:
$ fqc add -x Length -Y "Read Count" --step 10 \
      plot_data/2016/160912_M03018/config.json \
      "Joined Read Lengths" \
      histogram \
      data/tables/histogram_example.csv
Plot Options
| Option | Value |
|---|---|
| filename | supports either a single file path or list of lists with [plot tab name, file path] pairs (see Plot Tabs) |
| tab_name | left main menu entry |
| status | left main menu icon – supports ‘pass’, ‘fail’, ‘warn’, or alternatively, omitted (see Tab Status) |
| chart_properties | See table below |
Chart Properties
| Option | Value |
|---|---|
| type | the required entry is ‘histogram’ |
| subtitle | an optional subtitle for the plot |
| x_label | x-axis label |
| x_value | the header label defined in filename corresponding to values |
| y_label | y-axis label |
| step | histogram bin size |
Example JSON entry:
{
    "filename": "histogram_example.csv",
    "tab_name": "Joined Read Lengths",
    "chart_properties": {
        "type": "histogram",
        "x_value": "Length",
        "x_label": "Length",
        "y_label": "Read Count",
        "step": 10
    }
}