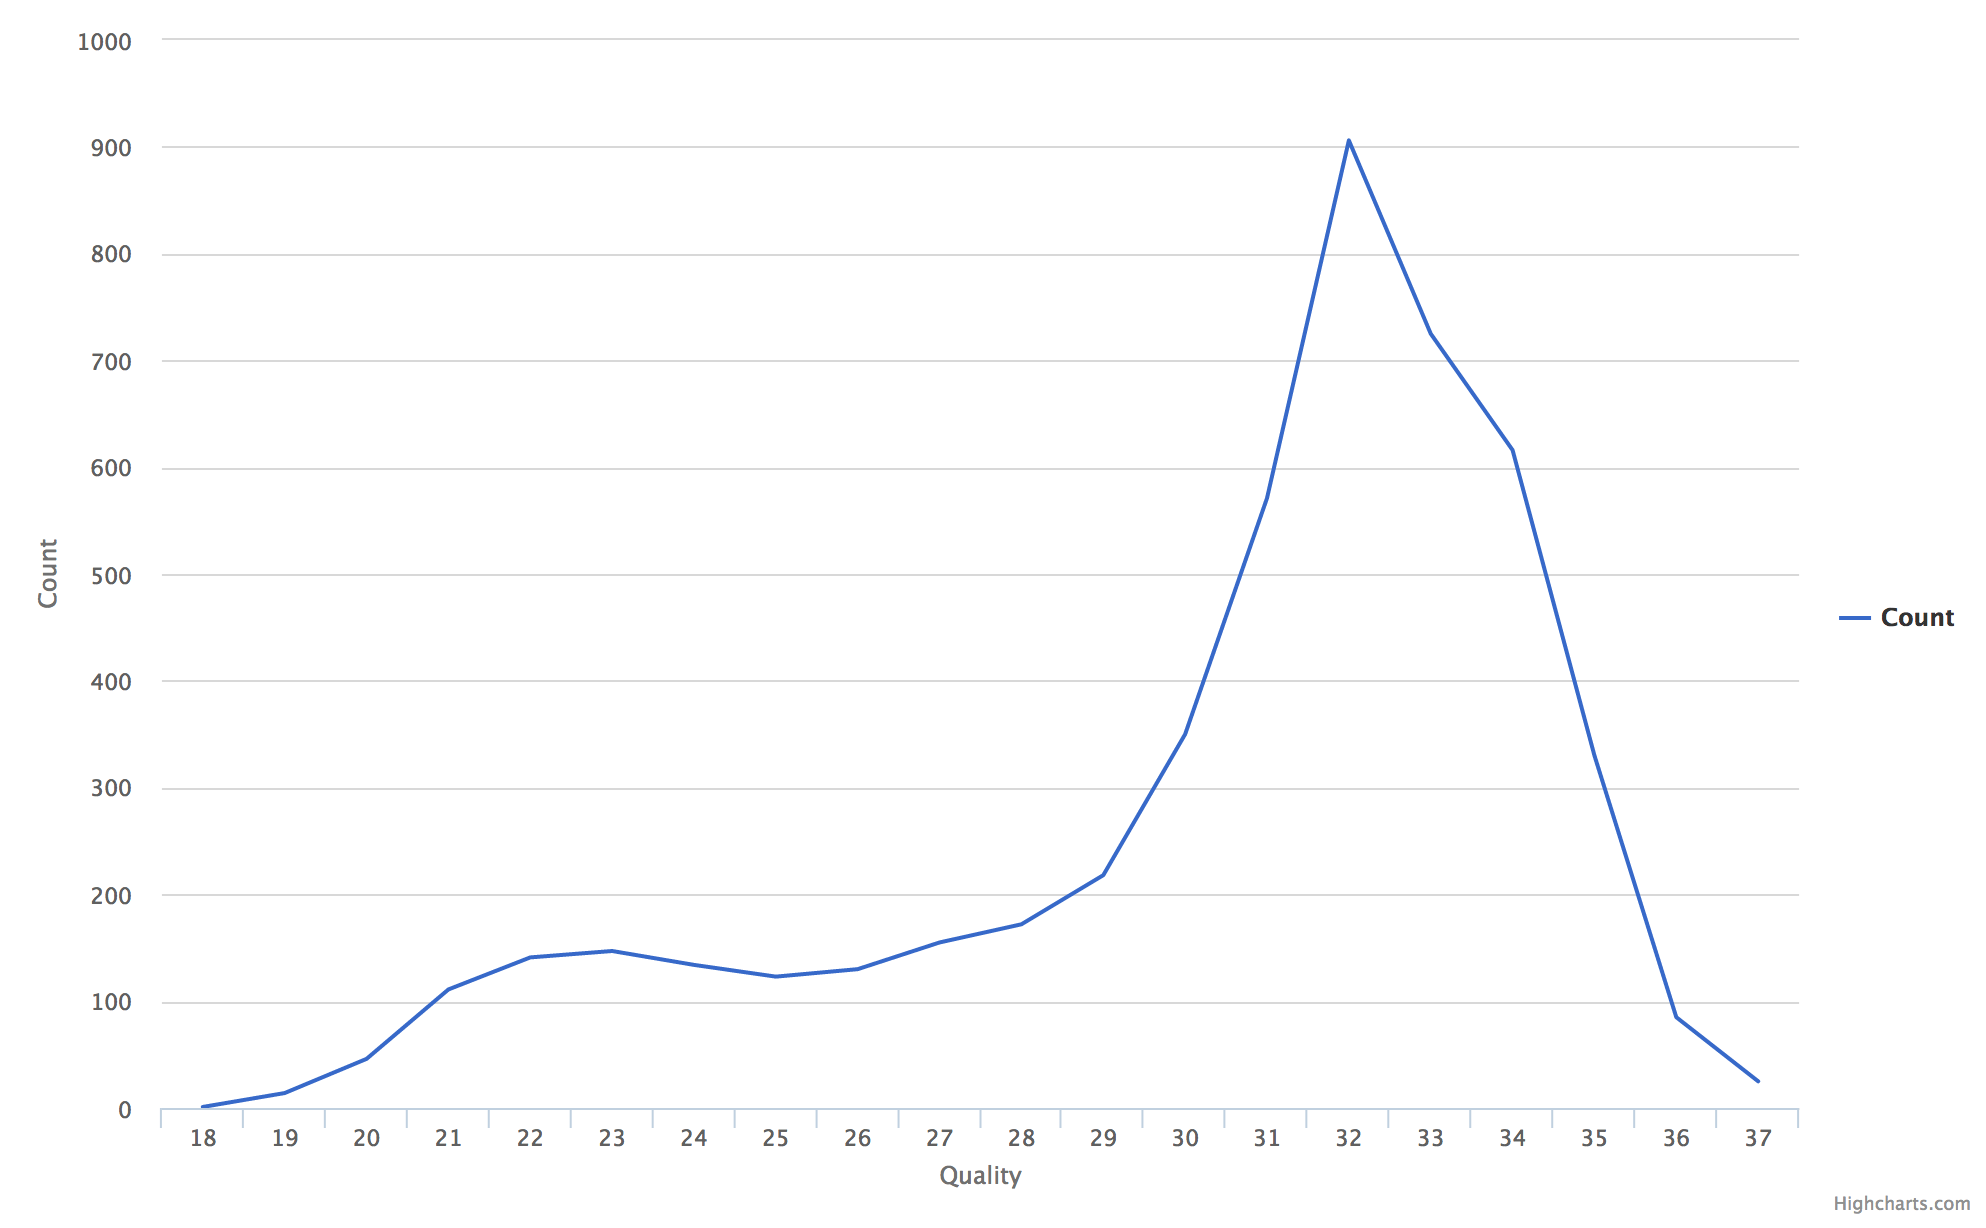
Line
Example Data
| Quality | Count |
|---|---|
| 18 | 1.0 |
| 19 | 14.0 |
| 20 | 46.0 |
| 21 | 111.0 |
| 22 | 141.0 |
Usage to Add
Given quality data across read positions, we can add this plot using:
$ fqc add --x-value Barcode --y-value Count \
      plot_data/2016/160912_M03018/config.json \
      "Barcode Counts" \
      bar \
      example/data/tables/160912_top50barcodes.csv
Plot Options
| Option | Value |
|---|---|
| filename | supports either a single file path or list of lists with [plot tab name, file path] pairs (see Plot Tabs) |
| tab_name | left main menu entry |
| status | left main menu icon – supports ‘pass’, ‘fail’, ‘warn’, or alternatively, omitted (see Tab Status) |
| chart_properties | See table below |
Chart Properties
| Option | Value |
|---|---|
| type | the required entry is ‘bar’ |
| subtitle | an optional subtitle for the plot |
| x_label | x-axis label |
| x_value | the header label defined in filename corresponding to x-values |
| y_label | y-axis label |
| y_value | the header label defined in filename corresponding to y-values |
Example JSON entry:
{
    "filename": "simple_line.csv",
    "tab_name": "Quality by Position",
    "chart_properties": {
        "type": "line",
        "x_value": "Quality",
        "x_label": "Quality",
        "y_value": ["Count"],
        "y_label": "Count"
    }
}
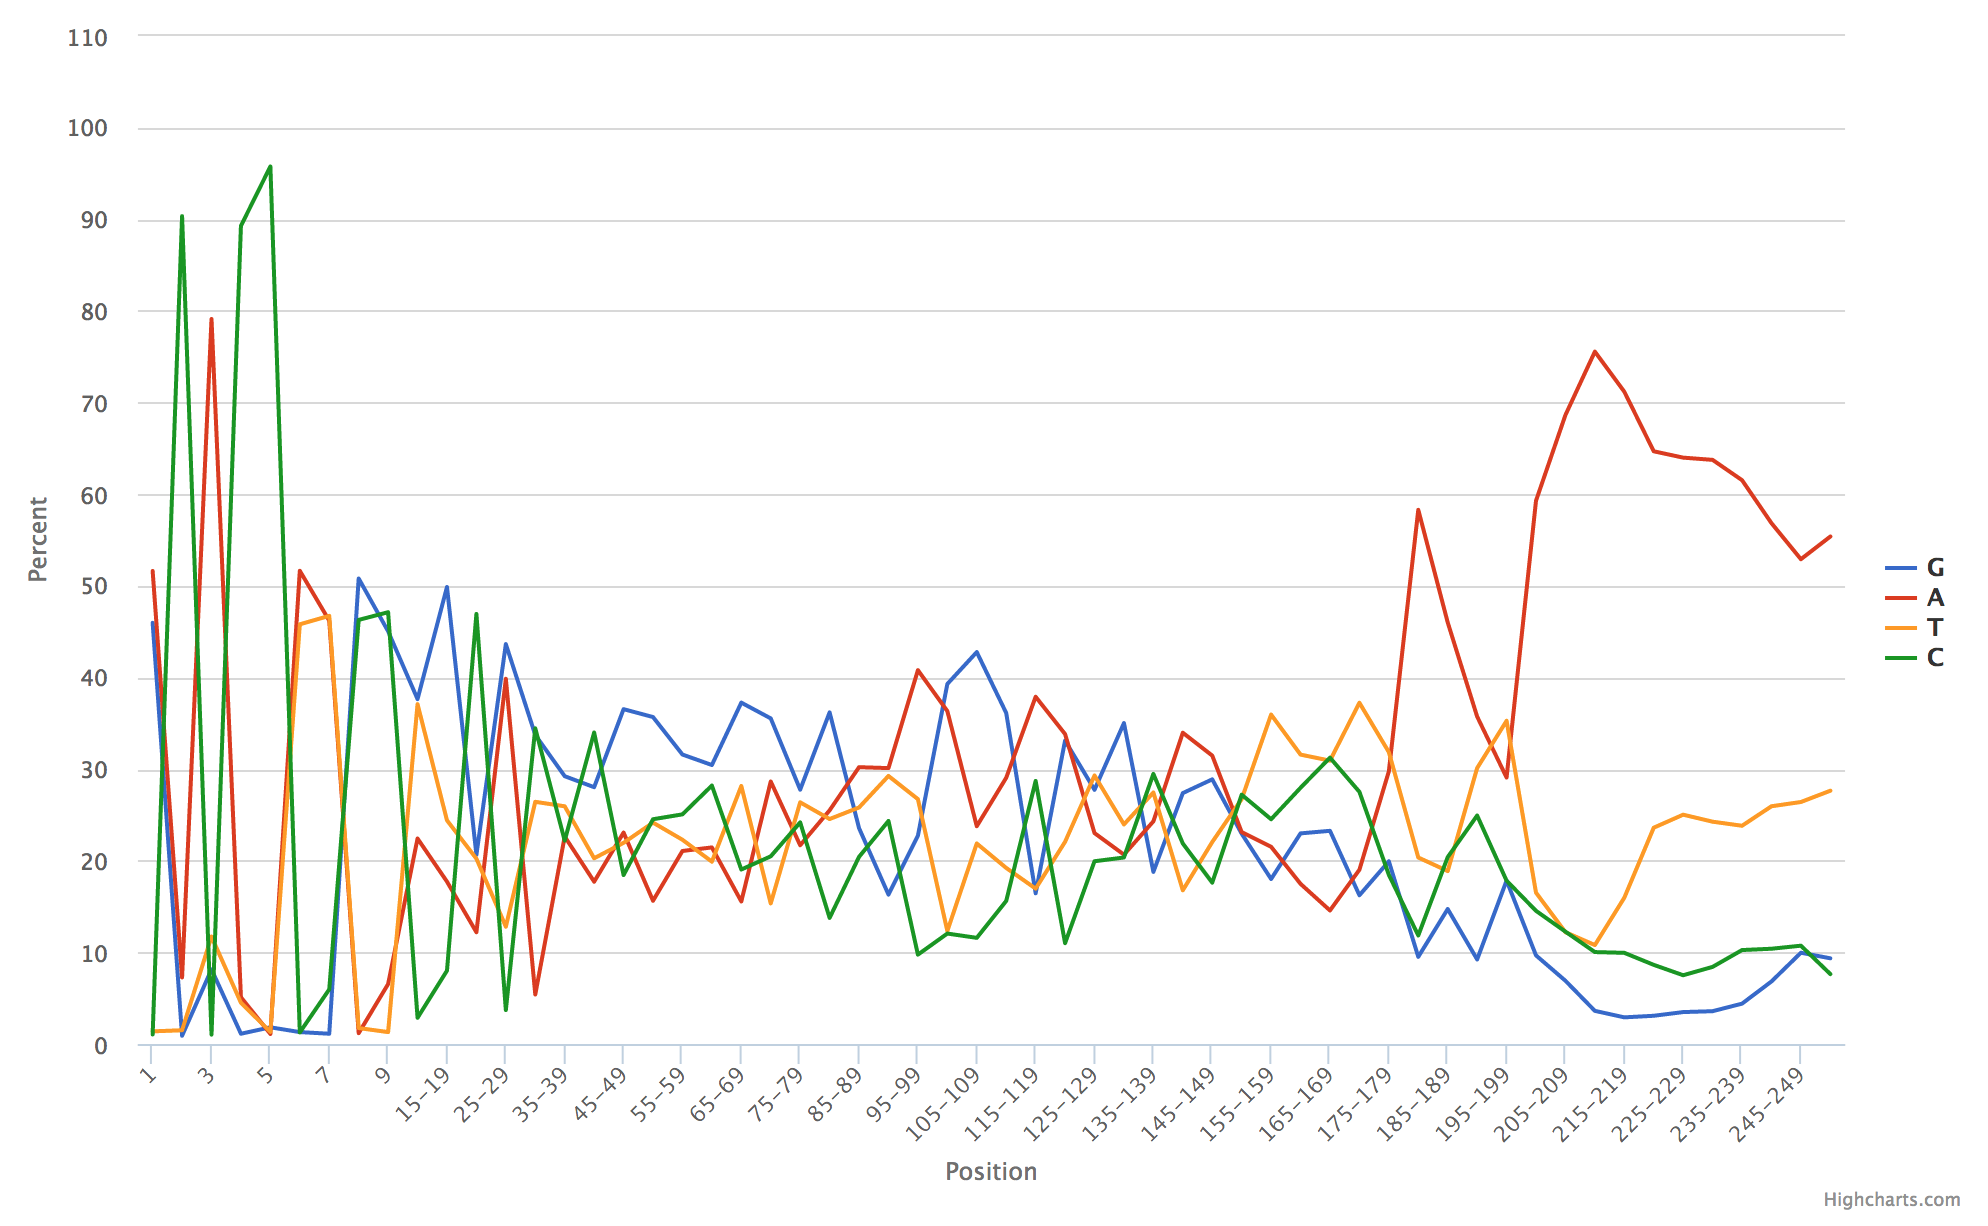
Multi-line Plots
When multiple y-values are being plotted:
| Base | G | A | T | C |
|---|---|---|---|---|
| 1 | 45.96 | 51.62 | 1.38 | 1.04 |
| 2 | 0.8999999999999999 | 7.26 | 1.5 | 90.34 |
| 3 | 8.14 | 79.12 | 11.72 | 1.02 |
| 4 | 1.1199999999999999 | 5.1 | 4.5 | 89.28 |
| 5 | 1.82 | 1.0999999999999999 | 1.32 | 95.76 |
These data are added by specifying -y multiple times:
$ fqc add -x Base -X Position \
      -y G -y A -y C -y T \
      -Y Percent \
      plot_data/2016/160912_M03018/config.json \
      "Content by Position" \
      line \
      data/tables/multiple_line.csv
Example JSON entry:
{
    "filename": "multiple_line.csv",
    "tab_name": "Content by Position",
    "chart_properties": {
        "type": "line",
        "x_label": "Position",
        "x_value": "Base",
        "y_label": "Percent",
        "y_value": [
            "G",
            "A",
            "C",
            "T"
        ]
    }
}