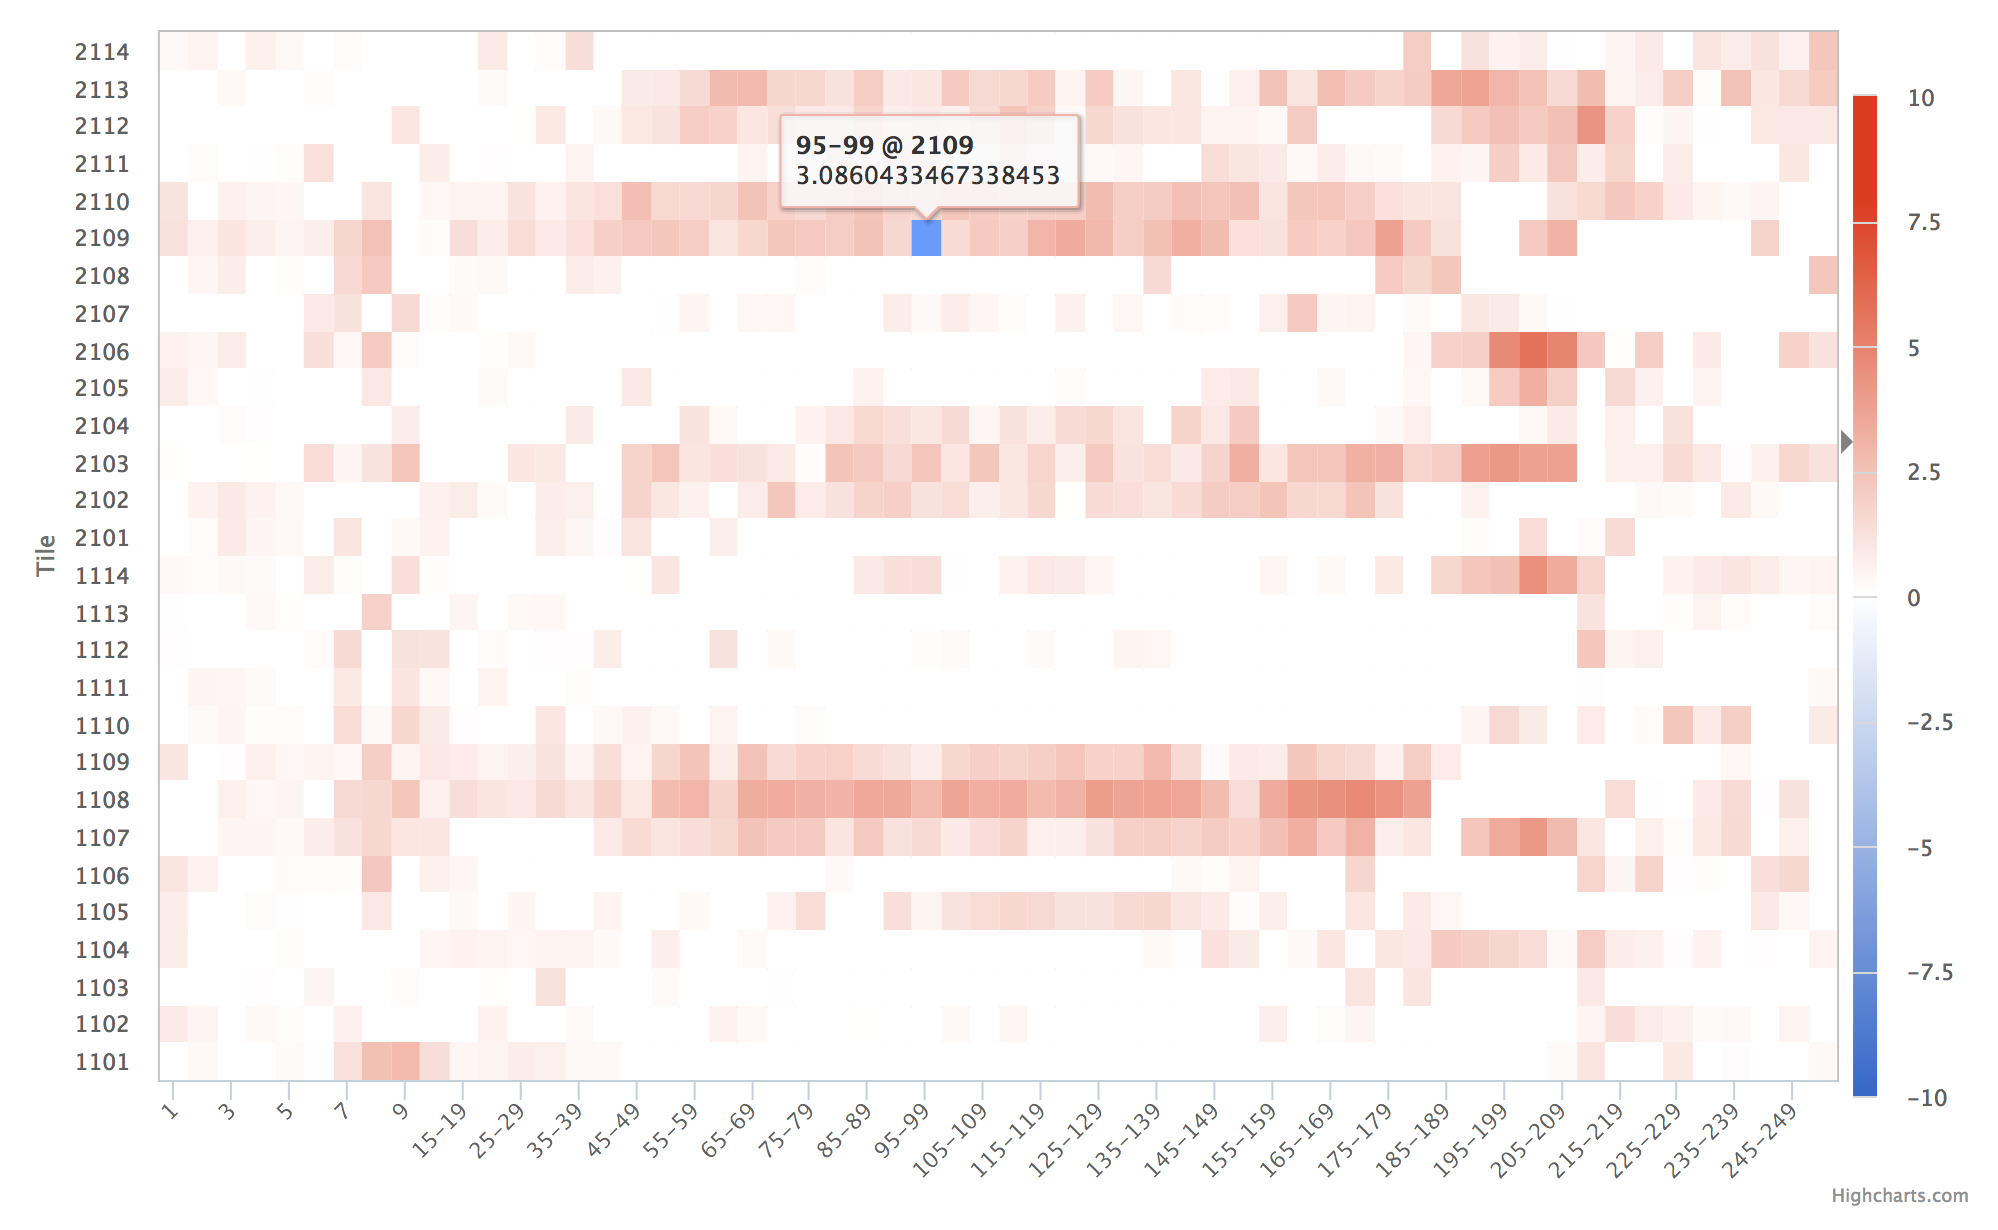
Heatmap
A heatmap is generated using tile quality data from FastQC, but a custom
one can be generated using data with an x, a y, and value associated
with the coordinate.
Example Data
| Tile | Base | Mean |
|---|---|---|
| 1101 | 1 | 0.4305 |
| 1101 | 2 | 0.1525 |
| 1101 | 3 | 0.0202 |
Usage to Add
Tile example data from FastQC can be added manually using:
$ fqc add --x-value Barcode --y-value Count --min-value -10 --max-value 10 \
      plot_data/2016/160912_M03018/config.json \
      "Barcode Counts" \
      bar \
      example/data/tables/160912_top50barcodes.csv
Plot Options
| Option | Value |
|---|---|
| filename | supports either a single file path or list of lists with [plot tab name, file path] pairs (see Plot Tabs) |
| tab_name | left main menu entry |
| status | left main menu icon – supports ‘pass’, ‘fail’, ‘warn’, or alternatively, omitted (see Tab Status) |
| chart_properties | See table below |
Chart Properties
| Option | Value |
|---|---|
| type | the required entry is ‘heatmap’ |
| subtitle | an optional subtitle for the plot |
| x_label | x-axis label |
| x_value | the header label defined in filename corresponding to x-values |
| y_label | y-axis label |
| y_value | the header label defined in filename corresponding to y-values |
| value | the header label defined in filename corresponding to heatmap values |
| min_color | the minimum color used in the heatmap color map |
| mid_color | the middle color used in the heatmap color map |
| max_color | the maximum color used in the heatmap color map |
| min | the minimum value defined for the heatmap color map |
| max | the maximum value defined for the heatmap color map |
Example JSON entry:
{
    "filename": "R1/Per_tile_sequence_quality.csv",
    "tab_name": "Quality by Tile",
    "status": "pass",
    "chart_properties": {
        "type": "heatmap",
        "subtitle": "Per Tile Average Quality Deviation",
        "x_label": "Position",
        "x_value": "Base",
        "y_label": "Tile",
        "y_value": "Tile",
        "shape": "square",
        "value": "Mean",
        "min": "-10",
        "max": "10",
        "min_color": "#36c",
        "mid_color": "#ffffff",
        "max_color": "#dc3912"
    }
}