Area Range
The area range plot is automatically generated from FastQC output for inspecting read quality as a function of position along the sequence.
Example Data
An example table after parsing output from FastQC looks like:
| Base | Mean | Lower Quartile | Upper Quartile |
|---|---|---|---|
| 1 | 32.193 | 32.0 | 33.0 |
| 2 | 32.365 | 32.0 | 33.0 |
| 3 | 32.570 | 32.0 | 33.0 |
Plot Options
| Option | Value |
|---|---|
| filename | supports either a single file path or list of lists with [plot tab name, file path] pairs (see Plot Tabs) |
| tab_name | left main menu entry |
| status | left main menu icon – supports ‘pass’, ‘fail’, ‘warn’, or alternatively, omitted (see Tab Status) |
| chart_properties | See table below |
Chart Properties
| Option | Value |
|---|---|
| type | the required entry is ‘arearange’ |
| x_label | x-axis label |
| x_value | the header label defined in filename corresponding to x-values |
| y_label | y-axis label |
| lower_quartile | the header label defined in filename corresponding to lower quartile values |
| upper_quartile | the header label defined in filename corresponding to upper quartile values |
| mean | the header label defined in filename corresponding to mean values |
| zones | defined as ‘value’:’color’ with an initial ‘color’ as the base; see example below |
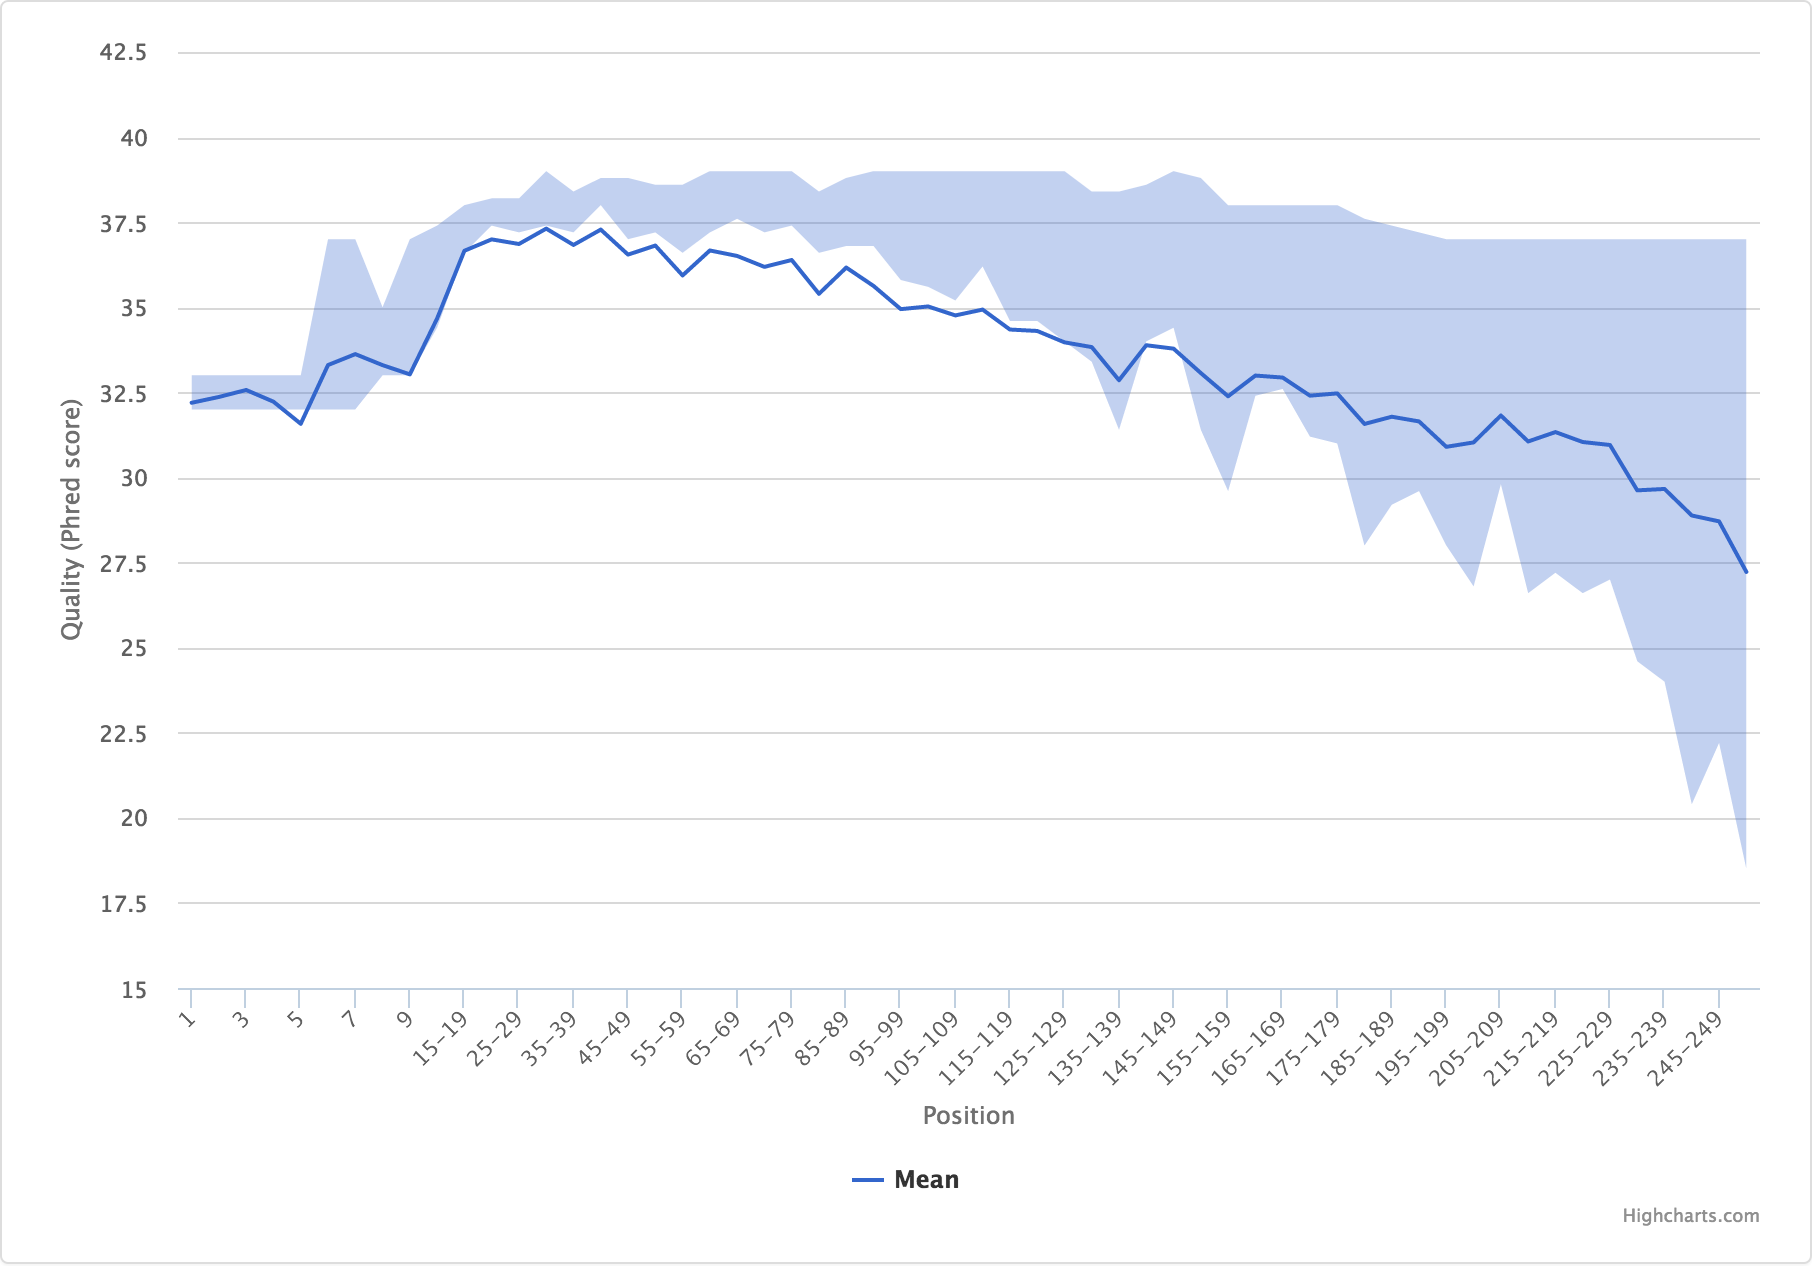
Example JSON entry:
{
    "filename": "R1/Per_base_sequence_quality.csv",
    "tab_name": "Quality by Position",
    "status": "pass",
    "chart_properties": {
        "type": "arearange",
        "x_label": "Position",
        "x_value": "Base",
        "y_label": "Quality (Phred score)",
        "lower_quartile": "Lower Quartile",
        "upper_quartile": "Upper Quartile",
        "mean": "Mean"
    }
}
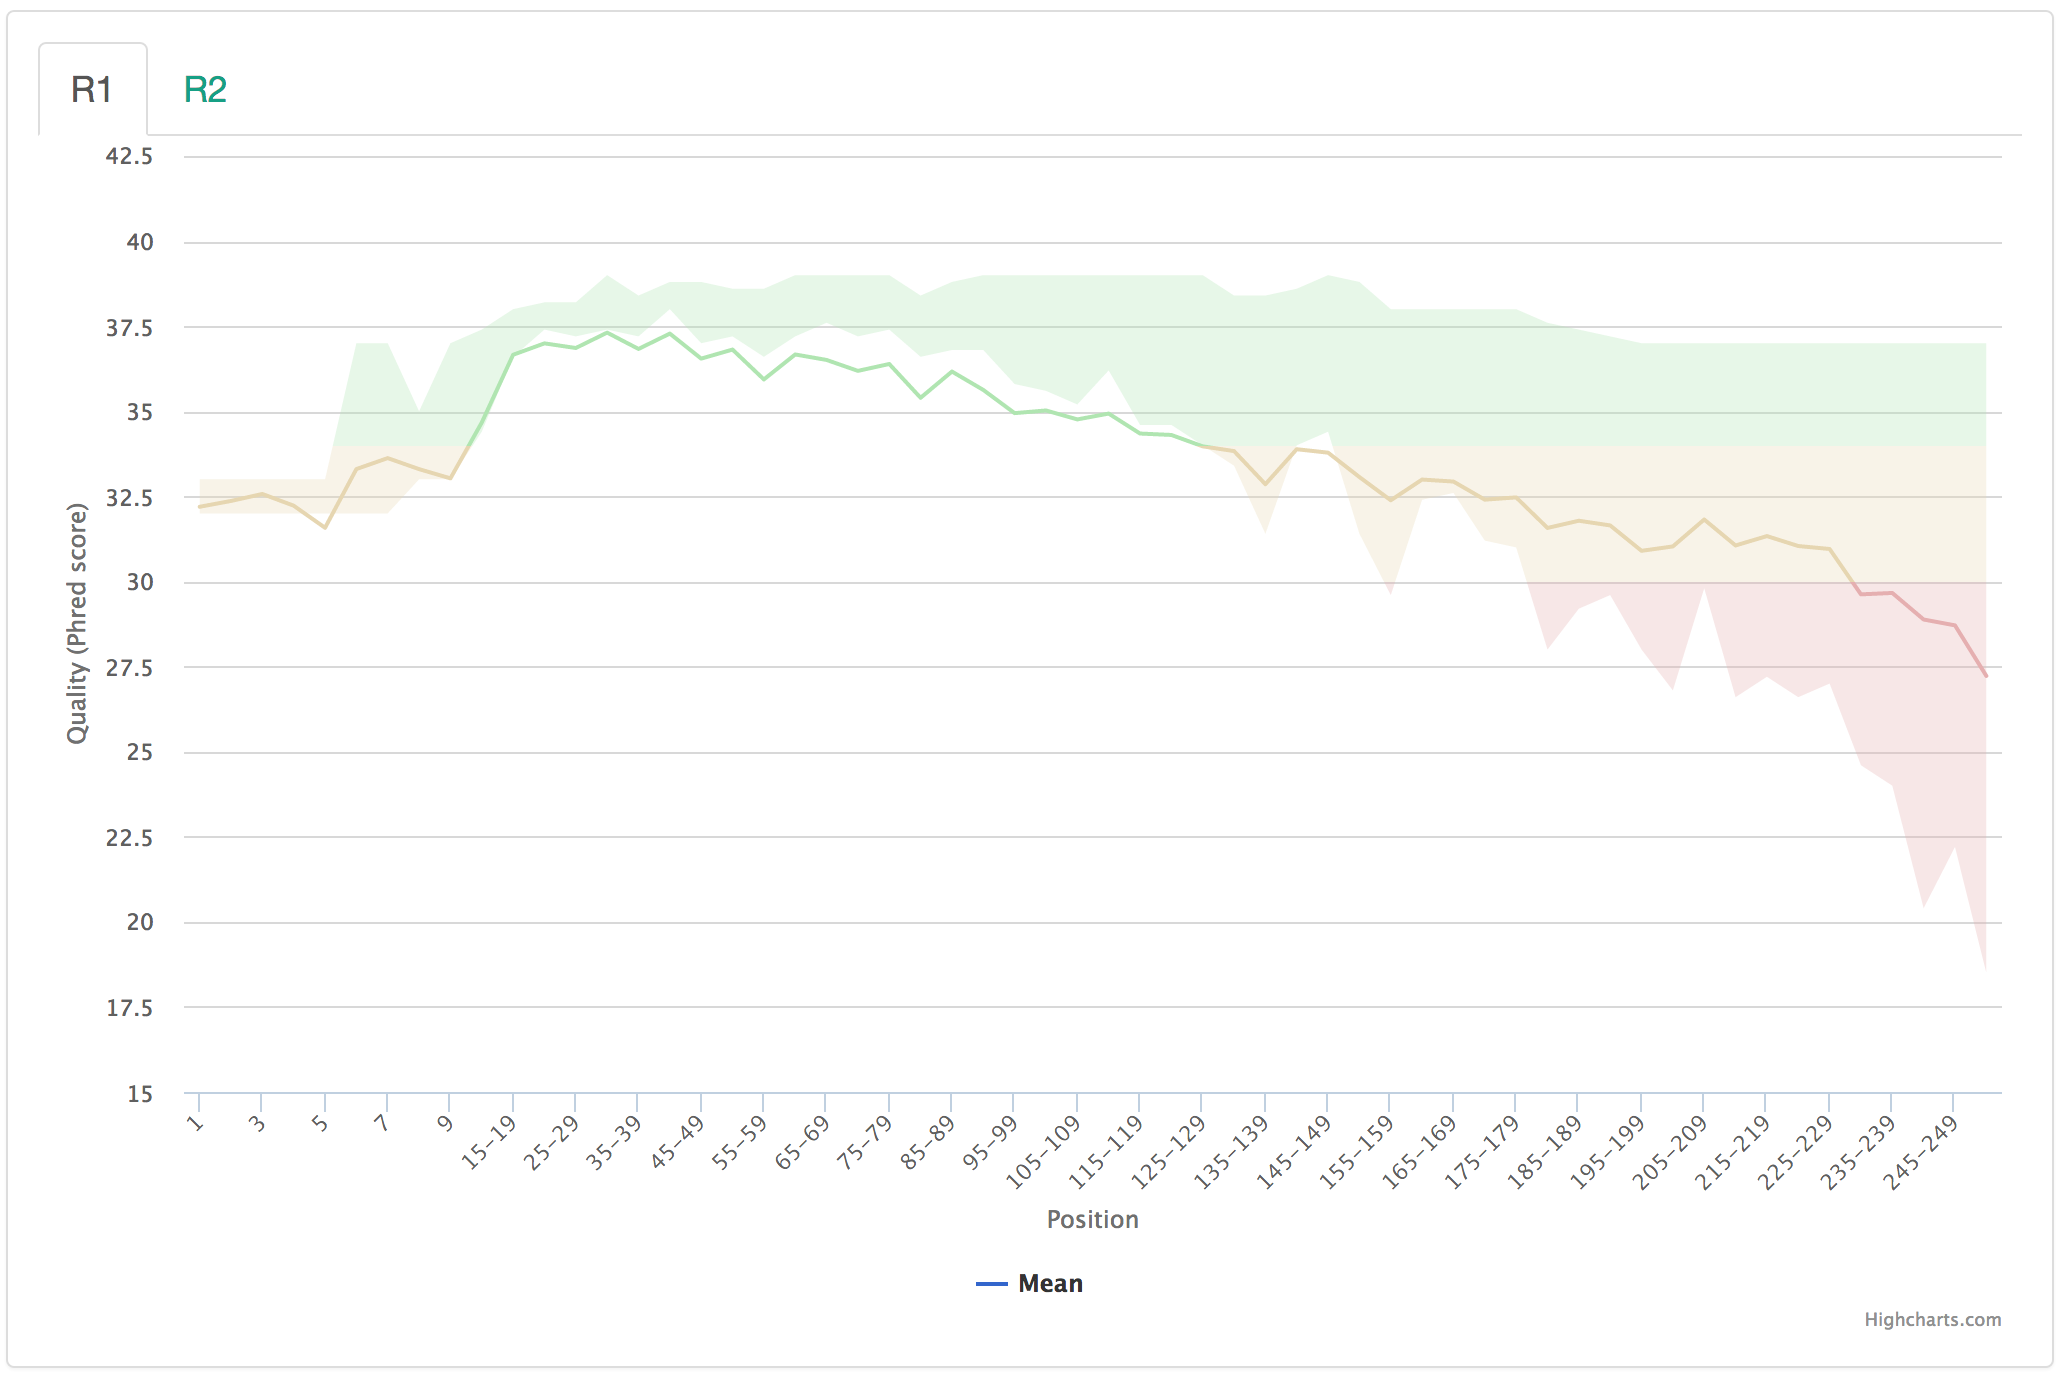
There is support for adding zones as well, if you’re going for the classic FastQC look and feel:
{
    "filename": [
        ["R1", "R1/Per_base_sequence_quality.csv"],
        ["R2", "R2/Per_base_sequence_quality.csv"]
    ],
    "tab_name": "Quality by Position",
    "status": "warn",
    "chart_properties": {
        "type": "arearange",
        "x_label": "Position",
        "x_value": "Base",
        "y_label": "Quality (Phred score)",
        "lower_quartile": "Lower Quartile",
        "upper_quartile": "Upper Quartile",
        "mean": "Mean",
        "zones": [
            {"value": 30, "color": "#e5afb0"},
            {"value": 34, "color": "#e6d6b1"},
            {"color": "#b0e5b1"}
        ]
    }
}